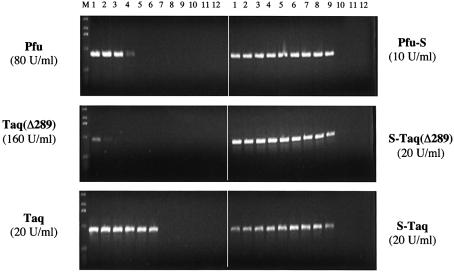
Figure 7.
Comparison of the salt tolerance of Sso7d fusions and the unmodified enzymes in PCR. λ DNA (130 pg/µl) was used as the template and a 0.9 kb amplicon was amplified in PCR buffer with increasing KCl concentrations. Lanes 1–12: 10, 20, 30, 40, 50, 60, 80, 100, 120, 140, 160 and 180 mM KCl. For Pfu and Pfu-S the PCR buffer contained 20 mM Tris–HCl pH 8.8, 10 mM (NH4)2SO4, 2 mM MgCl2, 0.1% Triton-100, 100 µg/ml BSA and 200 µM each dNTPs. For the other enzymes the PCR buffer contained 10 mM Tris–HCl pH 8.8, 2 mM MgCl2, 0.1% Triton-100 and 200 µM each dNTPs. The cycling protocol was 95°C for 20 s; 20 cycles of 94°C for 5 s and 72°C for 60 s; 72°C for 10 min. M indicates molecular weight marker.

