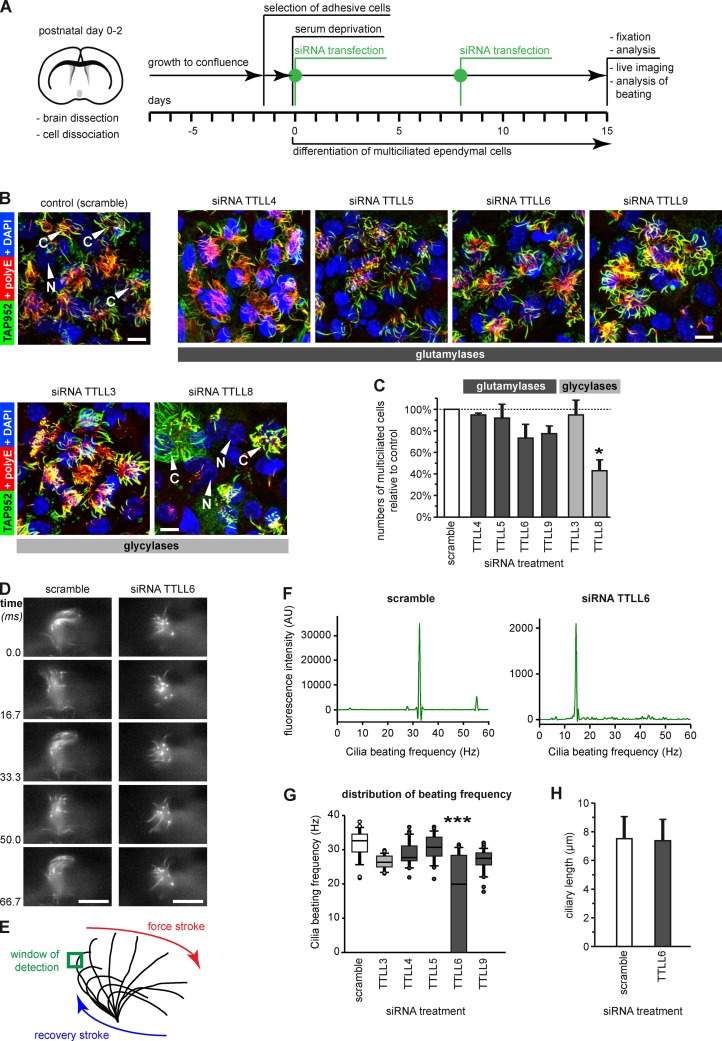
Figure 3.
Depletion of ependymal-specific glutamylases and glycylases induces different ciliary phenotypes in ependymal cells. (A) Flow scheme of the experimental paradigm of all siRNA experiments. (B) Analysis of multiciliated ependymal cells after siRNA. Cilia were co-labeled in fixed cells for polyglutamylation (polyE) and monoglycylation (TAP952). Bars, 10 µm. (C) Quantification of the relative numbers of multiciliated ependymal cells in areas with high cell density after siRNA treatment. The total number of cells (nuclei, DAPI) was related to the number of multiciliated cells polyE/TAP952 (B). Three independent experiments with more than 1,000 cells were analyzed, and controls (scramble siRNA) were set as 100%. Error bars represent SEM. After one-way ANOVA with Tukey’s post-hoc analysis, differences with P < 0.05 (*) were considered significant. (D) Image sequence of beating cilia after treatment with siRNA (A; 15 d), and labeling with Tubulin Tracker green. Ciliary beating was recorded at 120 frames per second (frame series of 75 ms; Videos 1 and 2). Bar, 10 µm. (E) Schematic representation of ciliary beating with the region of interest (green box) used for measurements. (F) Beating frequency distribution obtained by Fourier transformation of the beating frequency recording (E) of the cilia shown in D. (G) Box plot of the distribution of ciliary beating frequencies after siRNA (A). For each siRNA, three independent experiments, each with more than 25 cells, were recorded. Error bars show SEM; P < 10−6 (***) in Fisher variance test was considered significant. (H) The length of motile cilia after siRNA treatment measured on fixed cells (B) showed no difference between scramble and TTLL6 siRNA (Welch’s t test).

