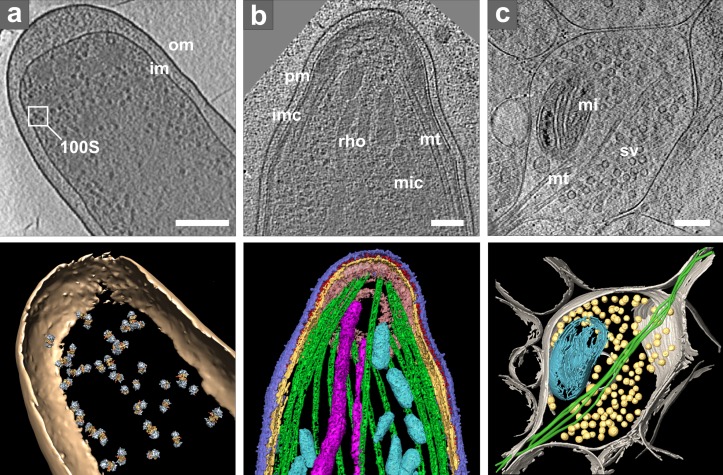
Figure 2.
Cryo-ET of intact cells. (a) Intact E. coli. Top: tomographic slice. Bottom: isosurface representation with positions of template-matched ribosome pairs: om, outer membrane; im, inner membrane; inset shows one ribosome pair (100S). Bar, 200 nm. Modified from Ortiz et al. (2010). (b) Plasmodium organelles and the associated cytoskeleton. Top: tomographic slice. Bottom: surface rendering showing plasma membrane (pm, blue), inner membrane complex (imc, yellow), density between pm and imc (red), microtubules (mt, green), apical polar ring (pink), rhoptries (rho, violet), and micronemes (mic, cyan). Bar, 100 nm. Reproduced from Kudryashev et al. (2010b). (c) Presynaptic terminal visualized in vitrified dissociated neuronal culture at 15 days in vitro and thinned by FIB milling. Top: tomographic slice (courtesy of Y. Fukuda). Bottom: 3D visualization: plasma membrane (gray), microtubules (mt, green), mitochondrion (mi, cyan), and synaptic vesicles (sv, yellow). Bar, 200 nm.

