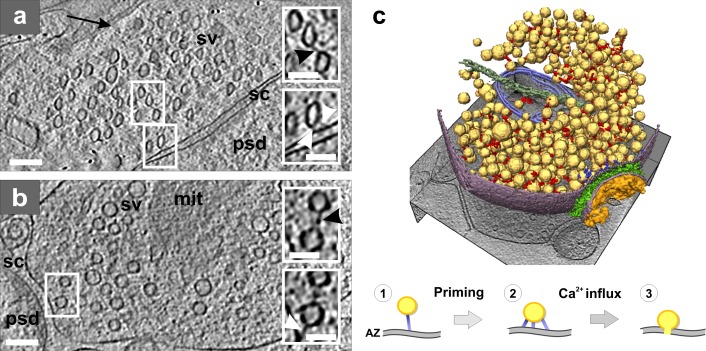
Figure 3.
Presynaptic cytomatrix. (a) Tomographic slice of a synapse from a high-pressure frozen organotypic hippocampal slice, thinned by vitreous sectioning. Synaptic vesicles are compressed along the cutting direction (arrow). Top inset shows a connector (black arrowhead) that links two vesicles. Bottom inset shows tethers (white arrowheads) that link a vesicle to the active zone (AZ). (b) Tomographic slice of a synapse obtained from the synaptosomal cellular fraction. Top inset: connector linking two vesicles (black arrowhead). Bottom inset: tether linking a vesicle to the AZ (white arrowhead; same vesicles as in the top inset at another z-slice). (a and b) Synaptic vesicle (sv), mitochondrion (mit), synaptic cleft (sc), and postsynaptic density (psd). Bars: (main panels) 100 nm; (insets) 50 nm. (c) 3D rendering of a synaptosome; synaptic vesicles (yellow), connectors (red), tethers (blue), mitochondrion (light blue), microtubule (dark green), plasma membrane (purple), cleft complexes (green), and PSD (orange). Proposed structural model of the synaptic vesicle mobilization and release: initial tethering (1), primed vesicle (2), and release (3). Image copyright Fernández-Busnadiego et al. (2010).

