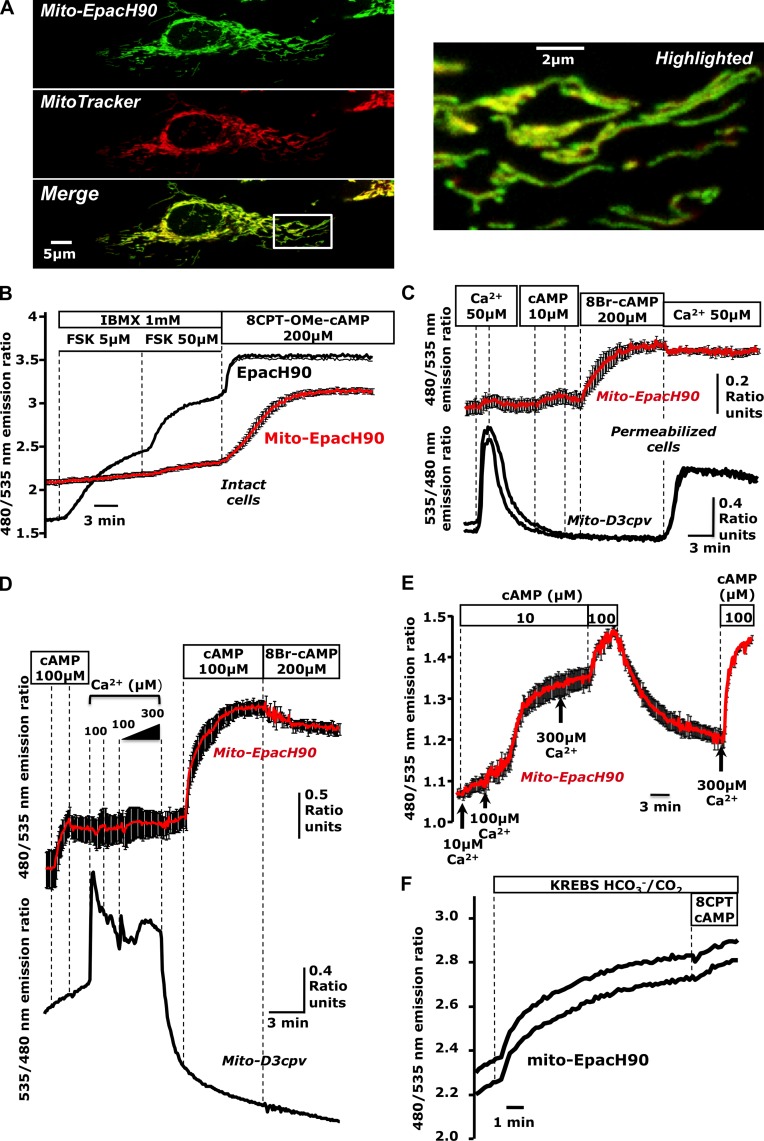
Figure 1.
Cyclic AMP produced in the cytosol does not reach the mitochondrial matrix. (A) Confocal images of HeLa cells expressing mito-EpacH90 and loaded with MitoTracker red suggesting proper localization of mito-EpacH90. (B) cAMP measurements in intact cells expressing cytosolic EpacH90 (black trace) or mito-EpacH90 (red trace; mean of five cells); typical of n = 9 experiments; 34 mito-H90, 19 Epac-H90 cells. (C) Digitonin-permeabilized HeLa cells expressing mito-D3cpv (black traces) or mito-EpacH90 (red trace; n = 6 experiments; 10 mito-D3cpv cells, 13 mito-EpacH90 cells; red trace indicates the mean of three cells). (D) Mixed populations of permeabilized HeLa cells expressing mito-D3cpv (black trace) or mito-EpacH90 (red traces; n = 3 experiments; 5 mito-D3cpv cells, 8 mito-EpacH90 cells). After Ca2+ pulses, mitochondria changed morphology and failed to retain Ca2+, (hallmarks of MPT), coincident with responses of mito-EpacH90 to exogenous cAMP. (E) Permeabilized HeLa cells expressing mito-EpacH90 (n = 5 experiments; 20 cells) subjected to increasing [Ca2+] in the presence of cAMP (10 µM). 100 µM Ca2+ induced a dramatic increase in cAMP measured by mito-EpacH90. (F) Cells expressing mito-EpacH90 bathed in Hepes-buffered normal Ringer’s solution (continuous perfusion) then switched to CO2/HCO3−-buffered Krebs-Ringer’s, inducing an apparent cAMP rise (presumably due to matrix sAC activation). Data from two representative cells are shown (n = 6 repeats; 16 mito-EpacH90 cells). Error bars indicate mean ± SD.

