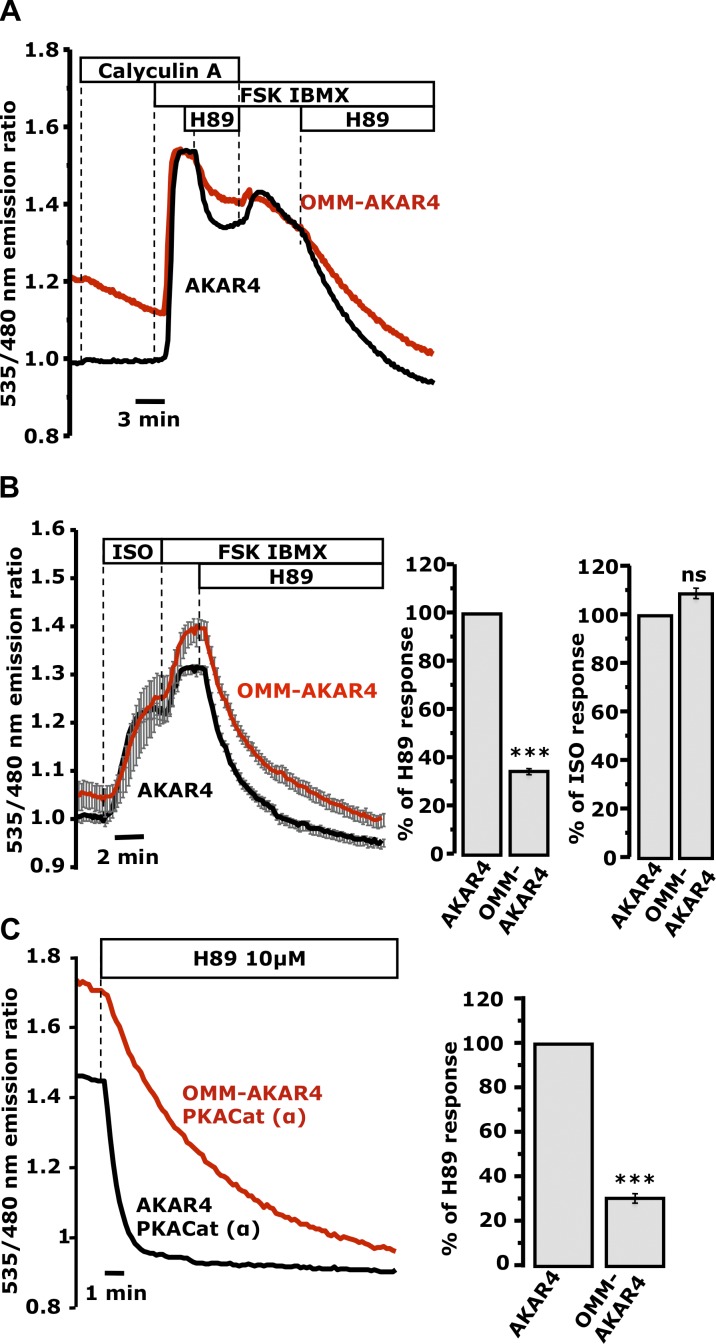
Figure 5.
Phosphatase-dependent termination of PKA signals at the OMM and cytosol. (A) Acute addition of 20 nM calyculin A to mixed populations of cells expressing OMM-AKAR4 (one representative cell; red trace) or AKAR4 (one representative cell; black trace; n = 6 experiments; 14 AKAR4 cells, 14 OMM-AKAR4 cells). (B) HEK cells expressing OMM-AKAR4 or AKAR4. (B, right) Mean of the slope of the responses to ISO (an estimate of PKA activity; n = 9 experiments; 40 AKAR4 cells, 22 OMM-AKAR4 cells) or 10 µM H89 on top of FSK/IBMX (an estimate of phosphatase activity). AKAR4, 39 cells; OMM-AKAR4, 25 cells; n = 12 experiments (***, P < 0.00015). (C) Mixed populations of HeLa cells expressing cyto-PKACat-mCherry together with OMM-AKAR4 (one representative cell; red trace) or with nontargeted AKAR4 (one representative cell; black trace; n = 11 repeats; 9 AKAR4 cells; 16 OMM-AKAR4 cells). The high starting ratios reversed with different kinetics upon addition of 10 µM H89 (P < 0.0002). (C, right) Mean slope of the responses to H89 across all experiments (***, P < 0.0002). Error bars indicate mean ± SD.

