
Figure 4.
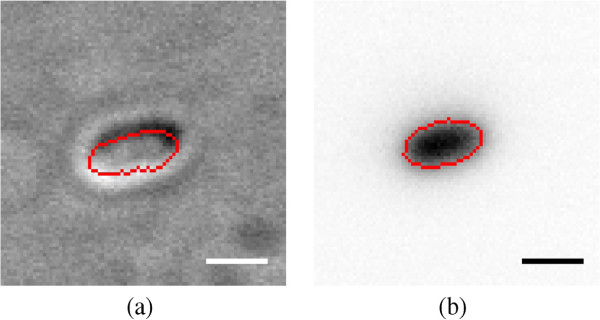
Validation - DIC vs. fluorescence. Comparison between segmentations of bacterial cell observed on DIC (a) and fluorescence (b) microscopy images. An overlay of the segmented cell body is in red. Scale bars correspond to 1 [μm].
Official websites use .gov
A
.gov website belongs to an official
government organization in the United States.
Secure .gov websites use HTTPS
A lock (
) or https:// means you've safely
connected to the .gov website. Share sensitive
information only on official, secure websites.
Validation - DIC vs. fluorescence. Comparison between segmentations of bacterial cell observed on DIC (a) and fluorescence (b) microscopy images. An overlay of the segmented cell body is in red. Scale bars correspond to 1 [μm].