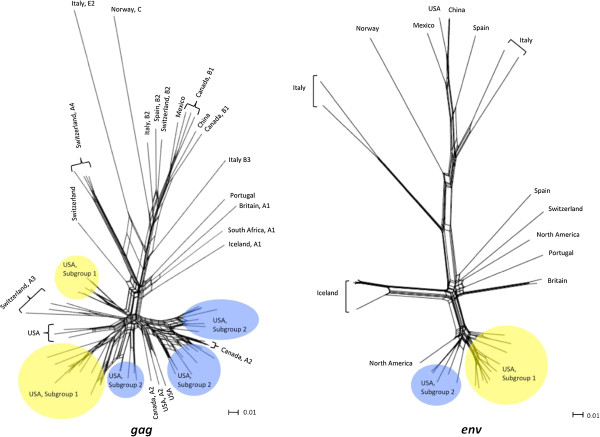
Figure 6.
Neighbor-Joining network comparisons of sequences produced in this study with those available from GenBank. Sequences representing SRLVs of known geographical origin are labeled in the networks. Capital letters and numbers following the country of origin in the gag network represent previously reported genotypes and subtypes, respectively. The scale bars represent substitutions per site.

