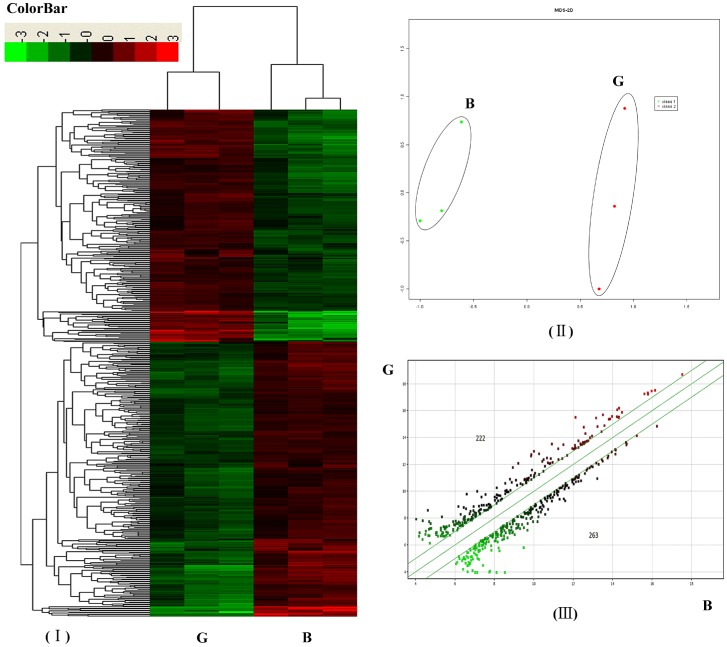
Figure 6. Transcription profile analysis of significantly differentiated expressed genes in S. japonicum from water buffalo (group B) and goats (group G).
(A) Hierarchical clustering using differentially expressed genes (probe sets) (p<0.05; FC>2); (B) Principal component analysis (PCA) of transcript profiles from groups B and G; (C) A scatter plot comparing groups G and B. The number at the upper left denotes up-regulated genes and the number at the lower right denotes down-regulated genes (p<0.05; FC>2).

