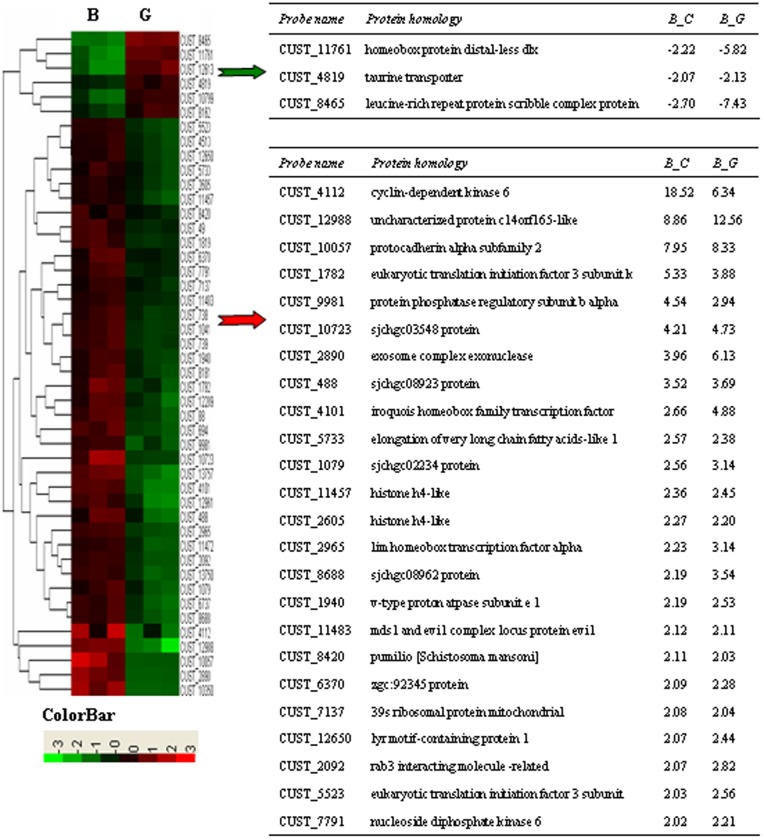
Figure 7. Heatmap clustering of common differentially expressed genes.
The right tables listed the common differentially expressed genes (p<0.05; FC>2). Schistosomes from water buffalo, yellow cattle, and goats were simplified as groups B, C, and G respectively. “-” indicates downregulation. FC is represented as the mean value. The tables do not contain genes without protein homology descriptions.

