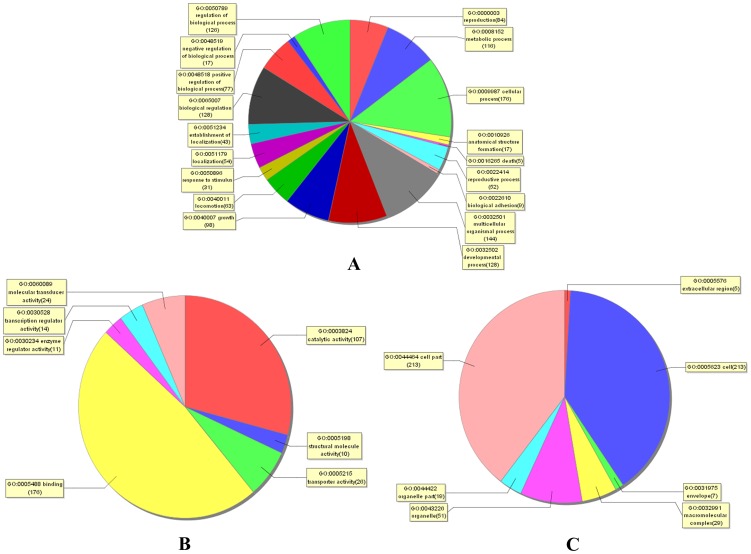
Figure 8. Distribution of gene ontology (GO) terms for the differentially expressed genes in schistosomes from water buffalo and goats.
A pie plot showing GO classifications of the biological processes (A), the molecular functions (B), and the cellular components (C). The graph excluded data without assigned GO terms.

