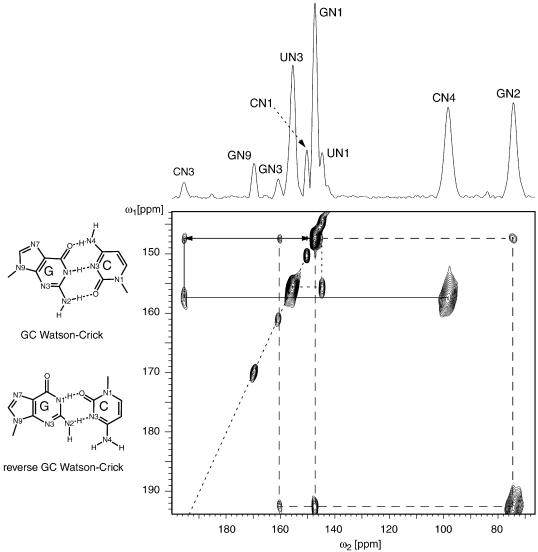
Figure 5.
Experimental 15N dipolar chemical shift correlation spectrum of the lyophylized and rehydrated RNA sample (zoomed plot) obtained at a spinning speed of 7000 Hz, with a data acquisition in the direct dimension of 10 ms, dipolar recoupling period of 20 ms, CP contact time of 175 µs, recycle time of 4.1 s, ω1 spectral width of 3000 Hz and 32 t1 increments with 512 transients per t1 increment. The RF carrier was kept at 164.6 p.p.m.. The amino nitrogen lines are folded in the ω1 dimension. Dipolar recoupling was effected by employing the [p5p7m4] phasing scheme with ‘cagauss’ adiabatic pulses (142 µs, 28.0 kHz γH1, 50 kHz sweep width) (23,32) as implemented in the Varian Pbox pulse-shaping software. The assignments of the different resonances are indicated in the spectral projection given. Also illustrated are the normal and reverse GC Watson–Crick base-pairing schemes. The spectral diagonal is indicated by a dotted line.

