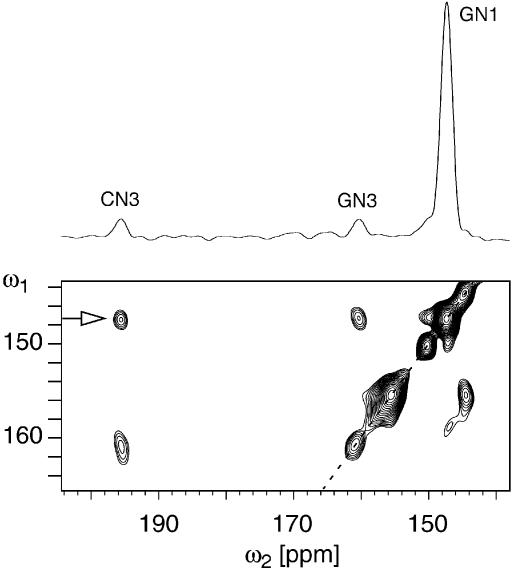
Figure 6.
Experimental 15N dipolar chemical shift correlation spectrum for the redissolved and frozen RNA sample (zoomed plot) obtained with a dipolar recoupling period of 14.28 ms, ω1 spectral width of 3200 Hz and 32 t1 increments with 640 transients per t1 increment. Dipolar recoupling was effected by employing the [p5m4] phasing scheme. The spectral cross- section taken at the position indicated is also given at the top of the 2D spectrum. Other parameters employed were as in Figure 5. The spectral diagonal is indicated by a dotted line.

