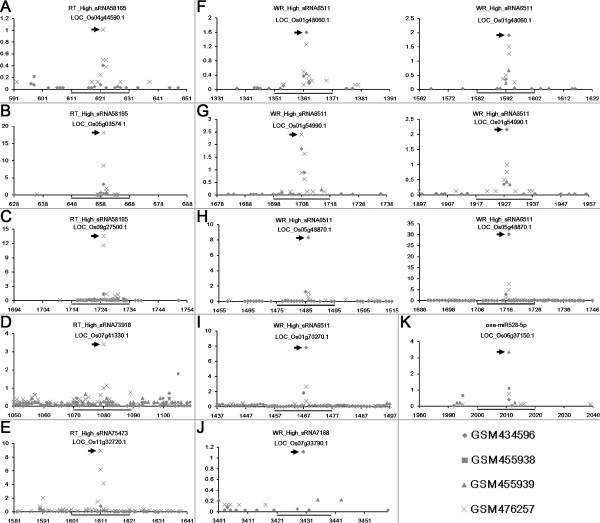
Figure 3.
Degradome sequencing data-based validation of the targets regulated by the small RNAs (sRNAs) highly accumulated in the root tips and the whole roots of rice. For all the figure panels (A to K), the IDs of the target transcripts and the regulating sRNAs are listed on the top. The y axes measure the intensity (in RPM, reads per million) of the degradome signals, and the x axes indicate the positions of the cleavage signals on the target transcripts. The binding sites of the sRNA regulators on their target transcripts were denoted by gray horizontal lines, and the dominant cleavage signals were marked by gray arrowheads. The figure keys for the degradome signatures from four libraries are shown on the bottom right. Please note, for (F) to (H), each target transcript possesses two binding sites of WR_High_sRNA6511.

