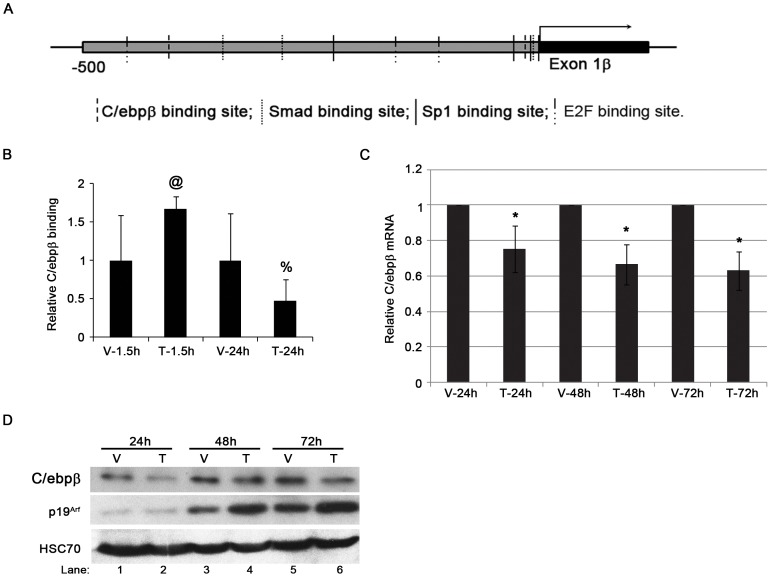
Figure 1. Inverse correlation of C/ebpβ and Arf expression during Tgfβ treatment.
(A). Schematic diagram showing potential C/ebpβ, Smad, Sp1 and E2F binding sites at the Arf promoter. (B). Tgfβ decreases C/ebpβ binding to the Arf locus in MEFs. Quantitative analysis of representative chromatin immunoprecipitation (ChIP) assays of using wild type MEFs exposed to vehicle (V) or Tgfβ (T) for 1.5 hours or 24 hours. ChIP assay was carried out using antibodies specific to C/ebpβ and IgG. Immunoprecipitated DNA and input DNA were amplified with primers for proximal regions genomic Arf promoter. p-values as follows: 0.1 (@) and 0.2 (%) for Tgfβ versus corresponding vehicle. (C). Quantitative analysis of real time, RT-PCR using total RNA isolated from WT MEFs shows the expression of C/ebpβ mRNA changes during Tgfβ treatment up to 72 hours. The data is plotted as the fold changes of target genes from cells treated with Tgfβ (T) (5 ng/ml) versus the same cells treated with vehicle (V) (4 mM HCl). The significant changes between Tgfβ treatment and vehicle treatment was marked as * (p<0.05). (D) Representative western blot of lysates from wild type MEFs treated with Tgfβ (T) and vehicle (V) at different time points showing the inverse correlation of C/ebpβ and Arf protein expression.

