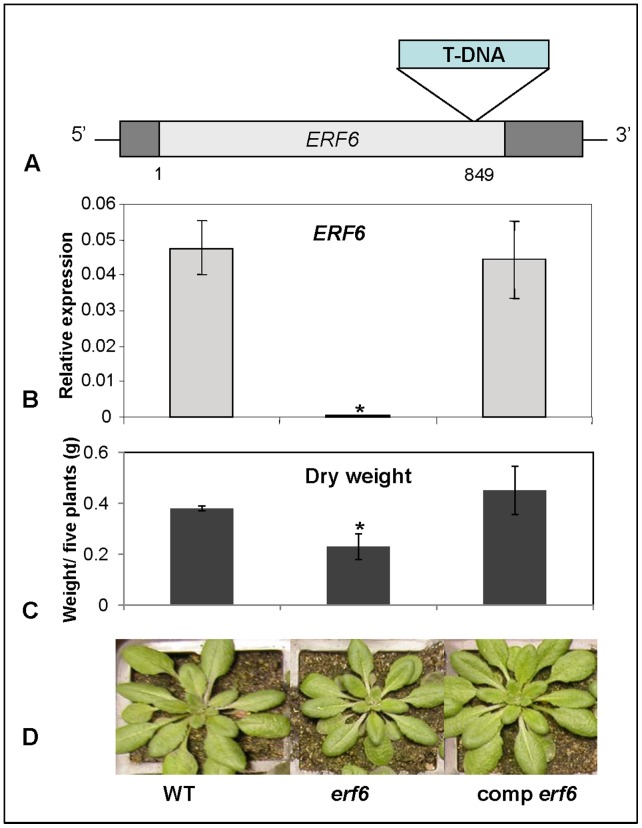
Figure 4. A) Schematic representation of the T-DNA insertion in the ERF6 gene.
Also shown are ERF6 expression (B), Dry weights (C) and phenotype of whole soil-grown wild-type (WT), erf6 mutant and complemented erf6 mutant plants (comp erf6) grown under normal conditions. Three independent biological replicates (with 20 plants each) were used. Error bars represent standard deviations. Asterisks indicate significant (P<0.05) differences between erf6 mutant compared to WT and complemented erf6 plants.

