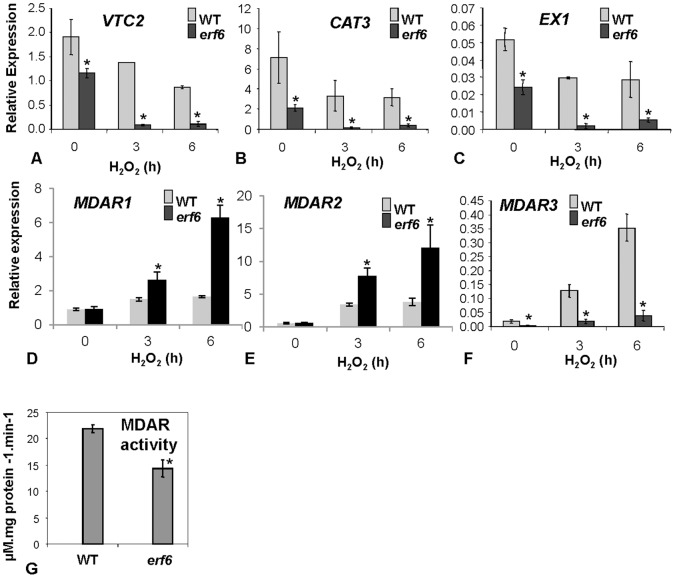
Figure 6. Gene expression levels of A) VTC2 (VITAMIN C DEFECTIVE2), B) CAT3 (CATALASE3), C) EX1 (EXECUTER1), D) MDAR1, E) MDAR2, and F) MDAR3 in WT and erf6 plants after H2O2 treatment.
Soil-grown 4-week-old Arabidopsis seedlings were either sprayed with H2O2 or with distilled water (control). The presented data for MDAR1 and MDAR2 represent the time point 6 h. G) Total MDAR activity in H2O2-treated wild-type (WT) and erf6 plants. Enzyme activity was measured after 6 h from spraying plants with H2O2. Three biological replicates (20 plants each) were used for each treatment. Error bars represent standard deviations. Asterisks indicate significant (P<0.05) differences between erf6 mutant and WT plants.

