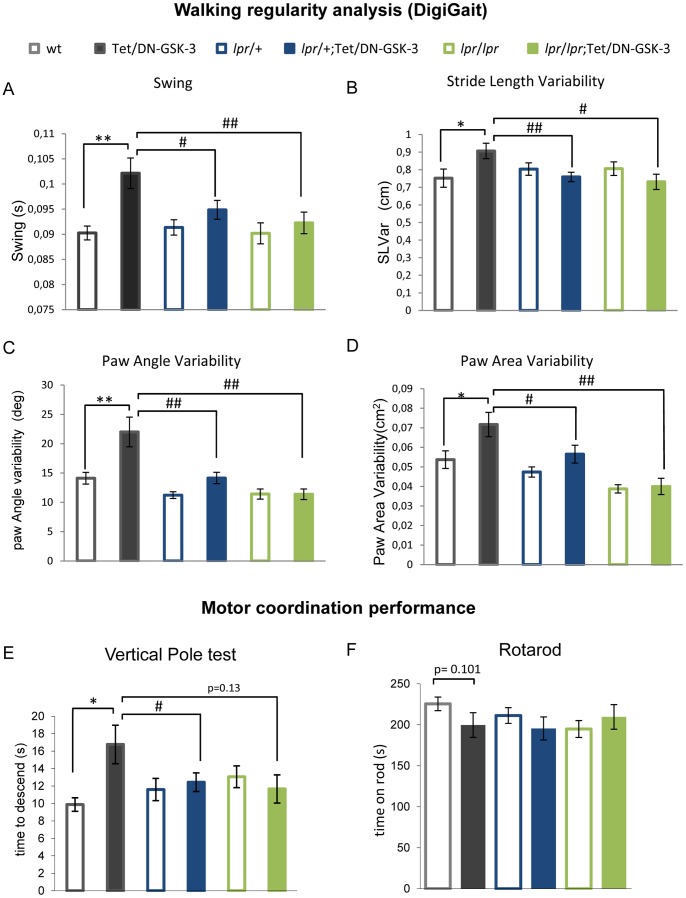
Figure 3. Motor deficits in Tet/DN-GSK-3 mice are Fas dependent.
A–D. Analysis of gait parameters by using the DigiGait apparatus. Analysis of swing duration (A), stride length variability (B), paw angle variability (C) and paw area variability (D) of experimental mice (wt, n = 13; Tet/DN-GSK-3, n = 12; lpr/+, n = 21; lpr/+;Tet/DN-GSK-3, n = 21; lpr/lpr, n = 14 and lpr/lpr;Tet/DN-GSK-3, n = 8). Statistical analysis of swing duration, stride length variability and paw angle variability was performed by applying one way-ANOVA test followed by a LSD post-hoc test. Statistical analysis of paw area variability was performed using Kruskal-Wallis test for no parametric distribution of data. Then paired genotypes analysis was performed following a Mann-Whitney U-test and Bonferroni correction was applied. *,# p<0.05; **,## p<0.01; ***,### p<0.001; * for wt vs. Tet/DN-GSK-3; # for Tet/DN-GSK-3 vs. lpr/+;Tet/DN-GSK-3 and lpr/lpr;Tet/DN-GSK-3 mice. E-F. Analysis of motor coordination. E. Time to descend in vertical pole test. (wt, n = 16; Tet/DN-GSK-3, n = 18; lpr/+, n = 28; lpr/+;Tet/DN-GSK-3, n = 23; lpr/lpr, n = 16 and lpr/lpr;Tet/DN-GSK-3, n = 10). Data are presented as the mean ± s.e.m. time to descend the pole. Statistical analysis was performed applying a one way-ANOVA test followed by a LSD post-hoc test. *,# p<0.05. F. Performance in the third and fourth accelerating trials represented as mean ± s.e.m. time on rod (wt, n = 16; Tet/DN-GSK-3,n = 19; lpr/+, n = 28; lpr/+;Tet/DN-GSK-3, n = 25; lpr/lpr, n = 16 and lpr/lpr;Tet/DN-GSK-3, n = 10). Statistical analysis was performed using Kruskal-Wallis analysis for no parametric distribution of data. Then paired genotypes analysis was performed following a Mann-Whitney U-test.

