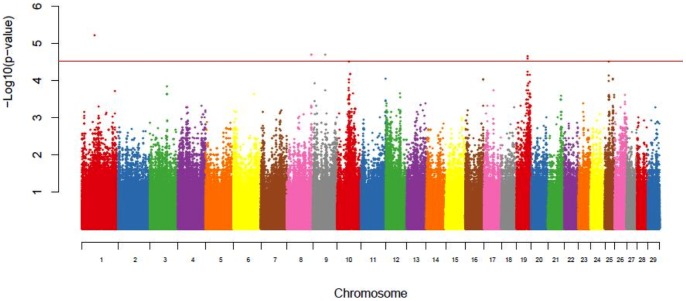
Figure 6. Genome-wide association or Manhattan plot of significance values for high fertile compared to low fertile heifers.
The results of the genome-wide association analysis are shown for chromosomes 1 through 29 and the X chromosome (labeled as 30). The results are plotted by the −log10 significance values on the y-axis and the chromosomal location for each SNP tested on the x-axis. The red line represents the Wellcome Trust threshold for moderate evidence for significance association.

