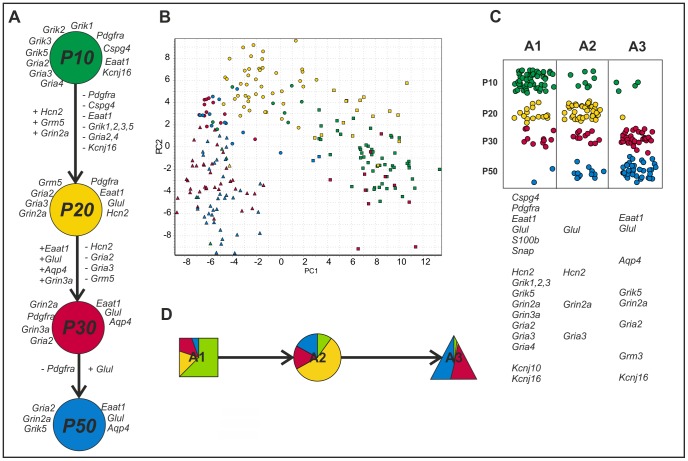
Figure 3. Gene expression profiling of cortical EGFP+ cells during postnatal development.
(A) Changes in the gene expression of highly expressed (log2 relative average expression above 2.3 from all data) astrocytic/NG2 glia markers and membrane proteins at P10 (green), P20 (yellow), P30 (red), and P50 (blue). The listed genes show at least 2-fold up (+) or 2-fold down-regulation (−) between sequential developmental stages. (B) PCA clustering of cells from all development stages (data mean-centered along genes). The stages are indicated in color (P10 green; P20 yellow; P30 in red, and P50 in blue), and the three groups identified by SOM are indicated by symbols (squares for A1; circles for A2, and triangles for A3). (C) The incidence of cells from the three subpopulations at different postnatal developmental stages. The genes under the table indicate highly expressed genes (log2 relative average expression above 1.8 and at least 40% positive cells) in particular subpopulations. (D) The distribution of developmental stages in the subpopulations.

