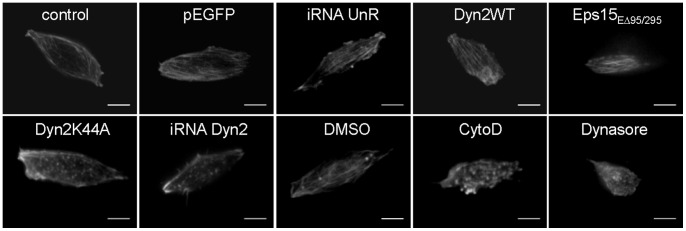
Figure 3. Impaired function or expression of dynamin-2 change F-actin organization pattern.

Cells were transfected with Life-act-ruby (n = 11) or co-transfected with Life-act-ruby and pEGFP (n = 34), iRNA-UnR (n = 9) Dyn2WT (n = 21), Dyn2K44A (n = 31), iRNADyn2 (n = 38) or Eps15ED95/295 (n = 17) plasmids and visualized by TIRF microscopy 48 h later. To evaluate the effects of a pharmacological inhibition of dynamin, cells transfected with Life-act-ruby were treated with 100 µM dynasore (n = 28), or the vehicle DMSO (n = 25) during 1 hr at 37°C. The 81.8% of control cells exhibited a “normal” pattern with clear cortical actin fibers. This value was not significantly different in cells expressing pEGFP (73.6%), iRNA-UnR (88.9%) or Dyn2WT (85.7%) constructs. However, the expression of Dyn2K44A or iRNADyn2, as well as the treatment with dynasore, modified the cortical actin organization and 80.6%, 92.1% and 71.4% of the cells, respectively, exhibited a “punctuate” pattern. The treatment with 4 µM CytoD during 10 minutes at 37°C produced exactly the same effect: 84.6% of the cells displayed a “punctuate” pattern. Eps15ED95/295 expression did not alter actin organization (82.4% of cells exhibited a normal pattern), indicating that dynamin, but not of endocytosis disruption, modified the actin cytoskeleton pattern. Scale bar = 5 µm.
