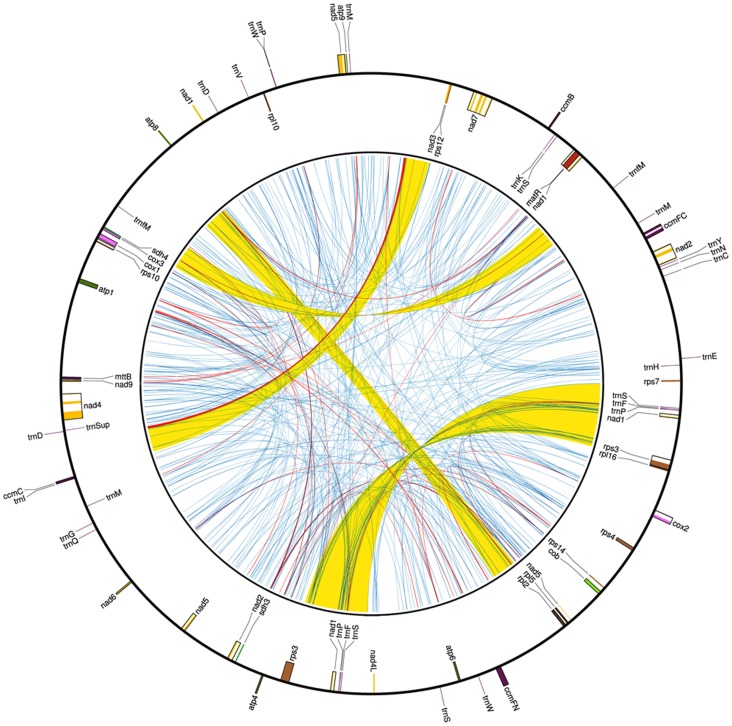
Figure 1. Genome map of Gossypium hirsutum mitochondrial genome.
The map shows both the gene map (outer circle) and repeat map (inner map). Genes exhibited on the inside of outer circle are transcribed in a clockwise direction, while genes on the outside of outer circle are transcribed in a reverse direction. The inner circle reveals the distribution of repeats in G. hirsutum mt genome. The yellow lines represent > = 1 kb repeats, the blue lines represent <100 bp repeat and the red lines represent repeat between 100 bp and 1 kb.

