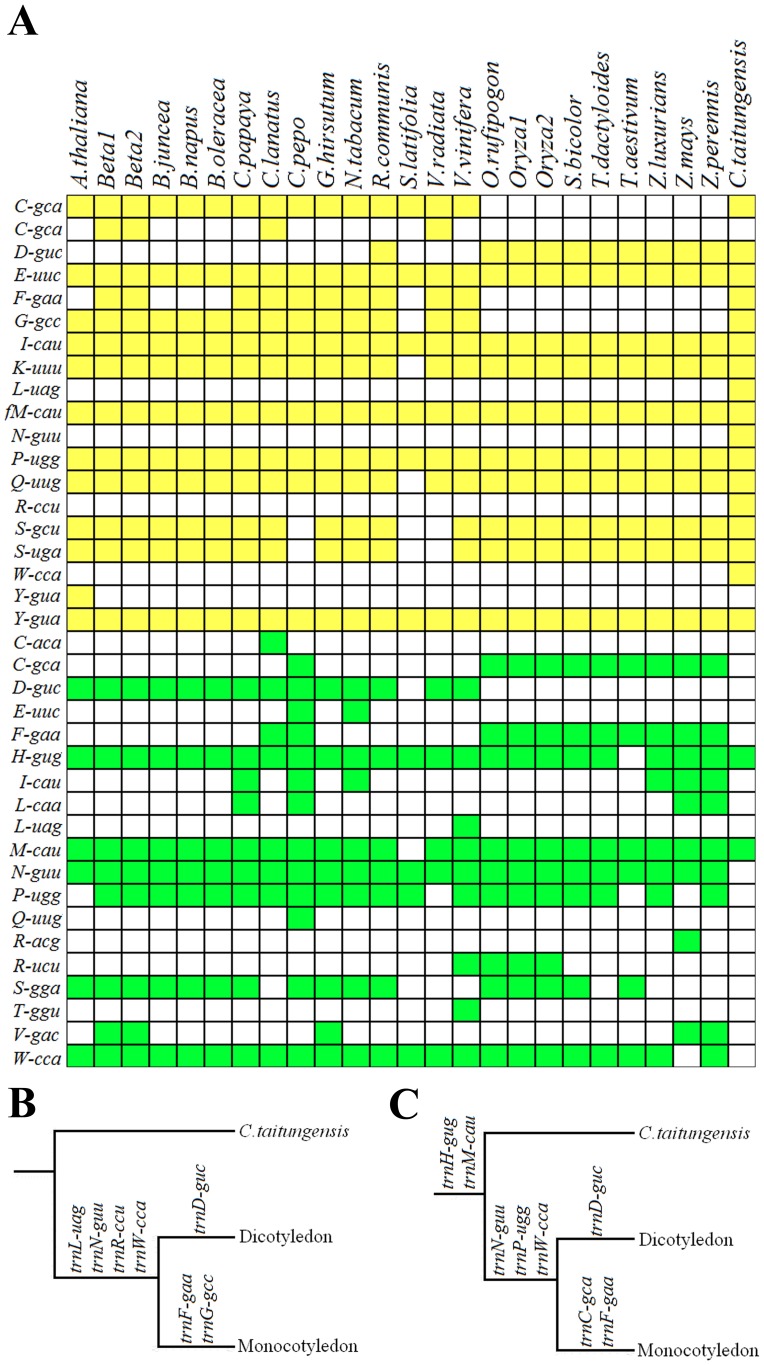
Figure 5. Distribution map of tRNA genes in 25 plants.
Figure 5A shows distribution of tRNA genes in higher plant mt genomes: the yellow boxs represented native tRNA genes, the green cells represent cp-like tRNA genes; Figure B shows uptake of cp-like tRNA genes during different evolutionary period; Figure C shows loss of native tRNA genes during different evolutionary period. The three Oryza genomes: 1, Oryza rufipogon; 2, Oryza sativa subsp indica; 3, Oryza sativa subsp japonica. The two Beta genomes are: 1, Beta vulgaris subsp maritima; 2, Beta vulgaris subsp vulgaris.

