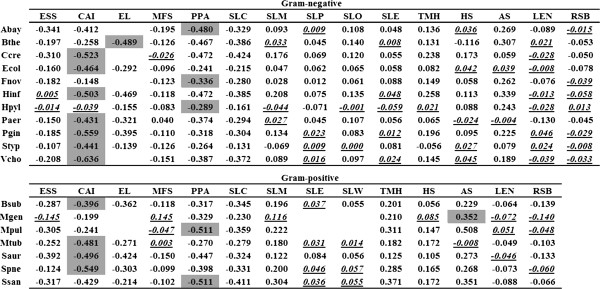
Figure 1.

Rank correlation coefficient of variables and expression rate (ER). Gray cells indicate the highest absolute coefficients obtained for each bacterium. Blanks indicate that variables are non-existent or defective. Italicized and underlined values are non-significant at p > 0.05.
