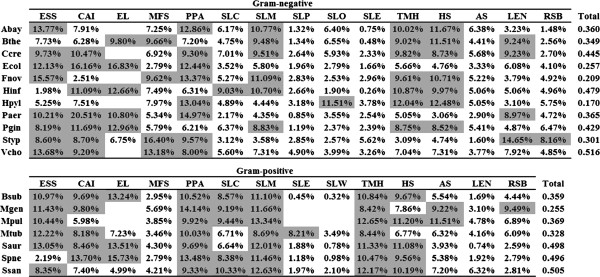
Figure 3.

Proportion of each independent contribution (R2) to total contributions. Cells highlighted in gray indicate variables that contributed at least 8% of the total contributions to the indicated species. Blanks indicate that variables are non-existent or defective.
