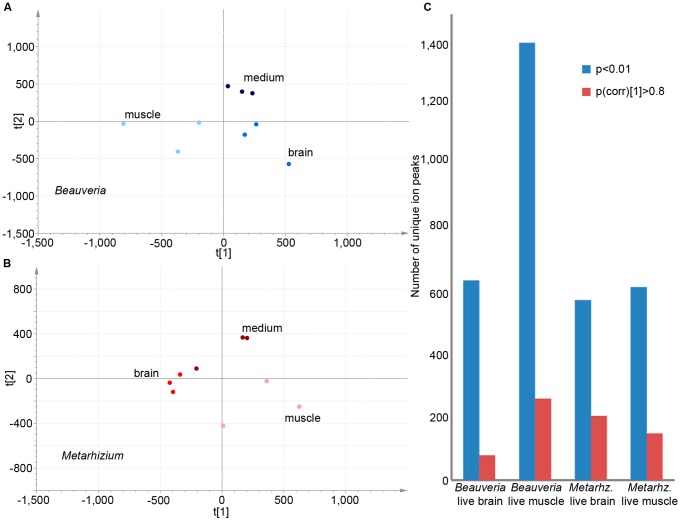
Figure 2. Overview of analyses to determine the tissue specificity of Beauveria and Metarhizium.
A) Supervised PCA plot showing the clustering of different types of Beauveria growth; growth on Schneider’s medium (dark blue), Schneider’s medium with ant brains (bright blue) and Schneider’s medium with ant muscles (light blue). B) Supervised PCA plot showing the clustering of different types of Metarhizium growth: growth on Schneider’s medium (dark red), Schneider’s medium with ant brains (bright red) and Schneider’s medium with ant muscles (light red). C) Bar graph displaying the number of unique ion peaks found to be significantly specific for growth on either live brain or muscle tissue. Both statistical methods used in this study are represented, p<0.01 being the number of peaks found significant from the t-test and p(corr) [1]>0.8 the ones found significant for the S-plot analysis.

