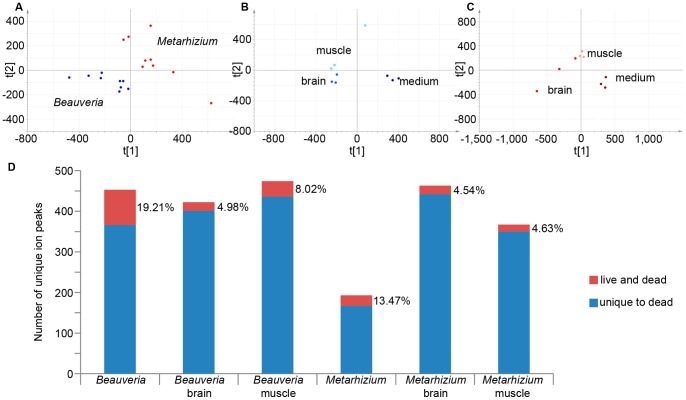
Figure 3. Overview of data obtained from analyses done to determine secretome heterogeneity on dead ant tissues.
A-C depict the supervised PCA plots for A) general Beauveria and Metarhizium growth on dead tissues, B) different types of Beauveria growth, and C) different types of Metarhizium growth. D) Bar graph representing the number of unique ion peaks found in the comparisons of the two fungal species with each other and the comparison of dead tissue growth related ion peaks within those species. The top part of the bars represents the percentage of metabolites in common with fungal growth on live tissues.

