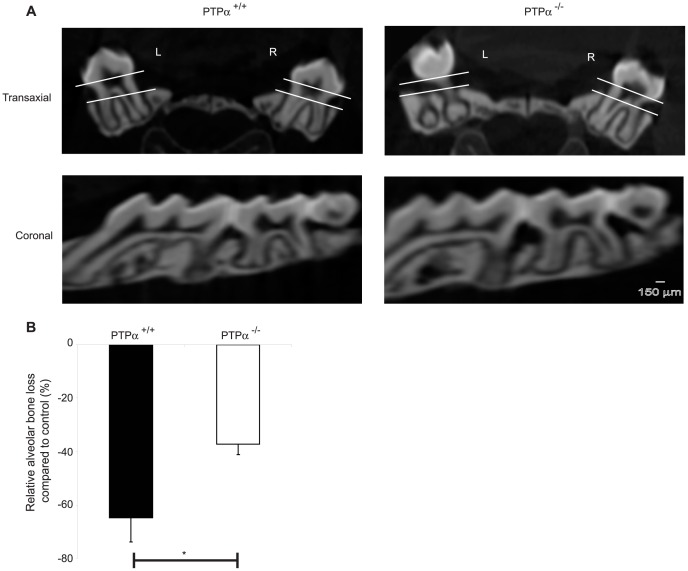
Figure 2. Bone loss analyzed by µCT scanning.
(A) Orthogonal views were generated using 3D reconstructed images on WCIF-ImageJ software. Using the coronal view, M2 was chosen and on the transaxial view the distance between CEJ (top line) and alveolar bone (bottom line) was determined on the left (L; ligated) and right (R; control) molars. (B) Relative (%) bone loss compared to the control side was calculated and presented as mean ± S.E.M. data from 5 maxillae per genotype. *p<0.05.

