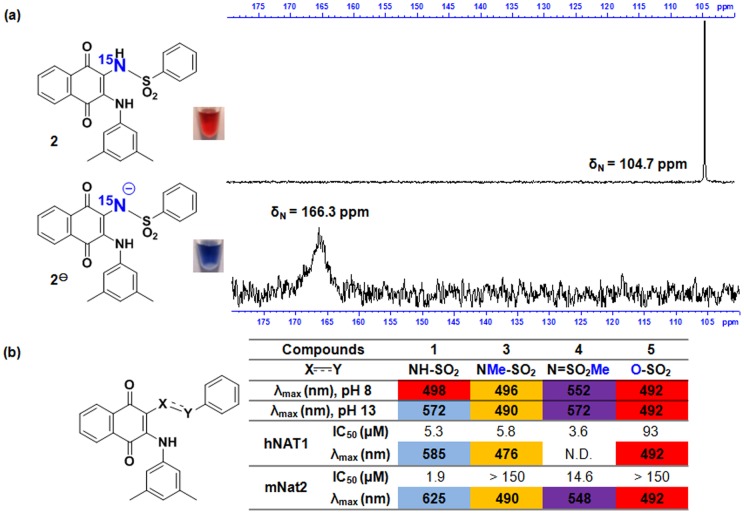
Figure 2. Requirement for the acidic proton of sulfonamide-NH for the color change event.
(a) Upper: 15 N-NMR spectrum of 2 in 95% DMSO-d6/5% H2O. Image of 50 μL of 2 (2 mM) in DMSO with 10 μL of 20 mM Tris.HCl, pH 8. Lower: 15 N-NMR spectrum of 2 in 95% DMSO-d6/5% aq. NaOD (final NaOD concentration 75.8 mM). Image of 50 μL of 2 (2 mM) in DMSO with 10 μL of 4 mM NaOH, pH 13. (b) Comparison of the colorimetric and inhibitory properties of compounds 1, 3, 4 and 5 towards hNAT1 and mNat2. Colors of cells indicate the observed color of the relevant compound under the given conditions.

