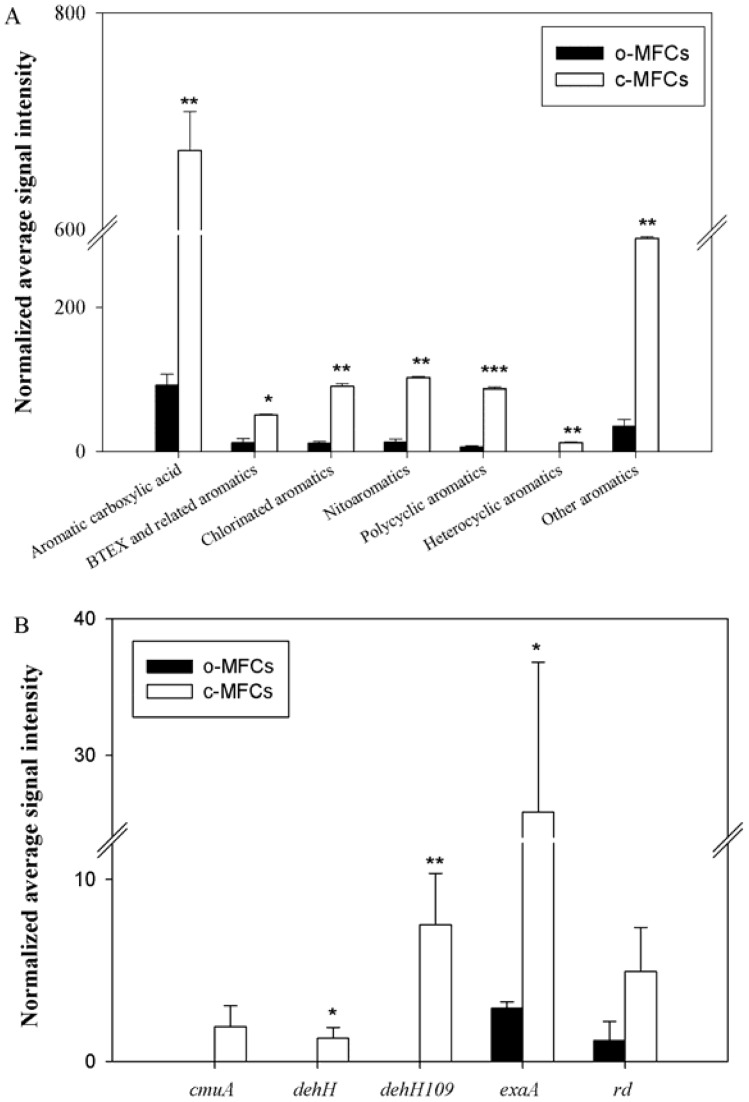
Figure 3. The normalized signal intensity of the detected key gens families involved in aromatic compound degradation (A) and chlorinated solvent remediation (B) under both c-MFCs and o-MFCs.
The signal intensities were the sum of detected individual gene sequences for each functional gene, averaged among three samples. All data are presented as mean±SE. *** p<0.001, **p<0.05, *p<0.10.

