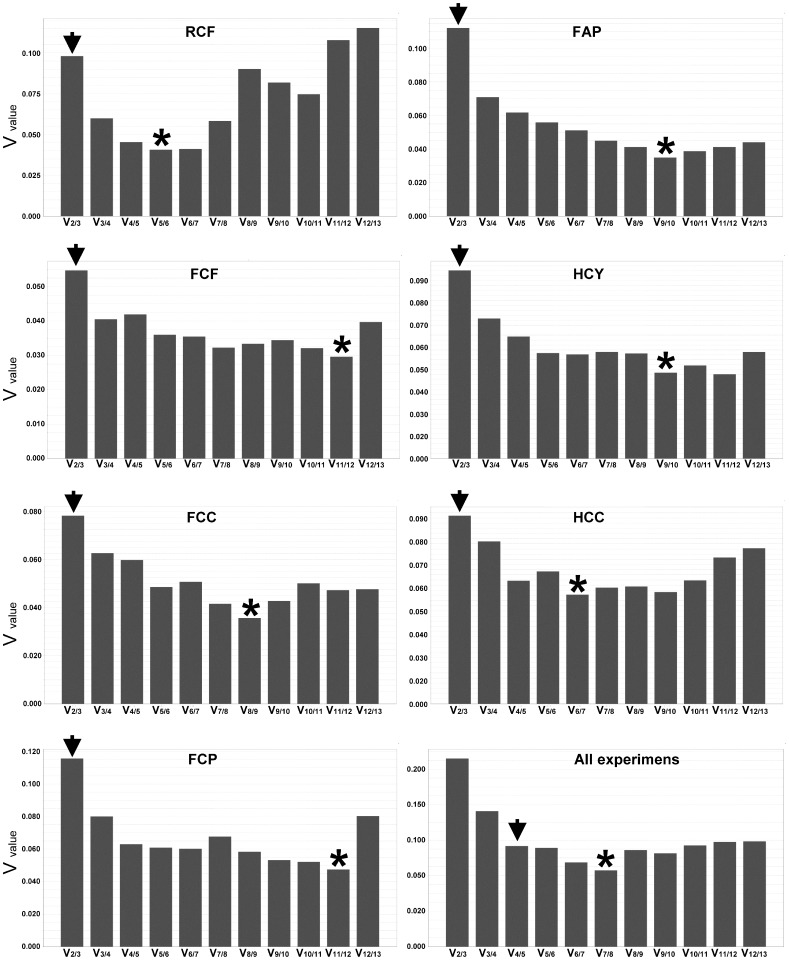
Figure 3. Determination of the number of genes required to calculate a hypothetical normalization factor.
Pairwise variation (Vn/n+1) analysis was carried out to determine the number of reference genes required for accurate normalization. An asterisk indicates the lowest V value in each experiment. An arrowhead indicates the minimum number of genes required to pass the suggested cut-off value (0.15) [4]. See Table 2 for experiment description.

