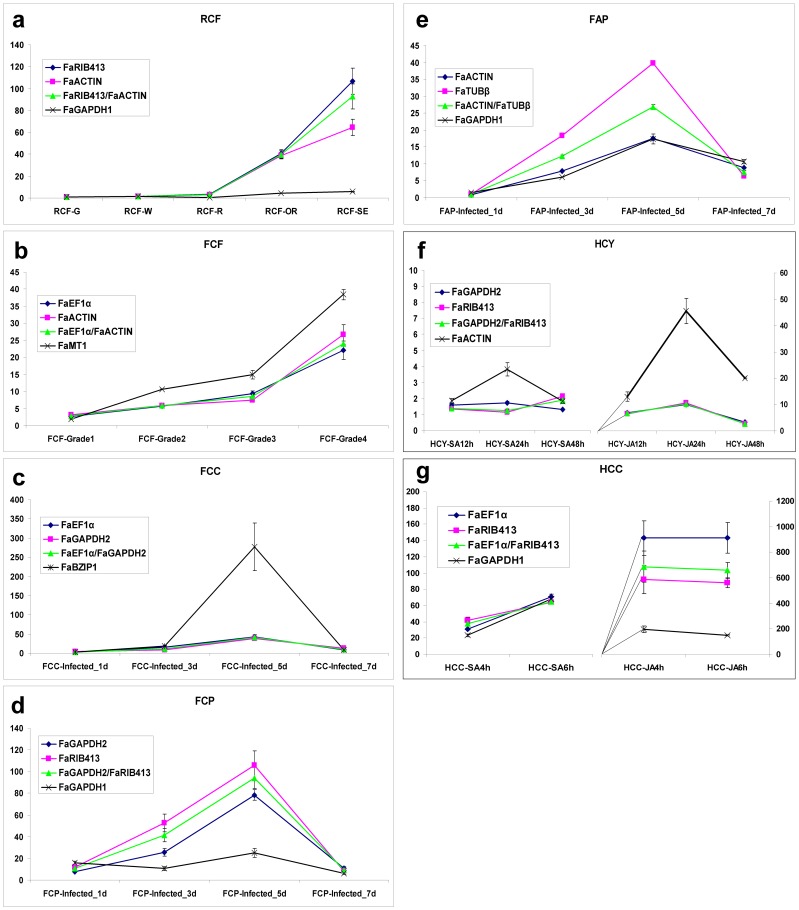
Figure 5. Transcript level relative quantification of the FaWRKY1 transcription factor.
FaWRKY1 gene expression was analyzed in strawberry under the seven independent experimental conditions used in this study. Error bars show standard deviation calculated from two biological replicates. Normalization factors were calculated as the geometric mean of the expression levels of the two most stable reference genes as recommended in Figure 4 for each single experiment. Normalization to each gene individually is also shown. Additionally, the least stable reference gene was used for normalization of each experiment to demonstrate the effect of unstable reference genes in the quantification of the relative amount of target gene mRNA. Every sample was calibrated with their corresponding mock sample (see Table 2 for experimental details). Black lines linked to the X axis have been added to f and g to illustrate range of gene induction.

