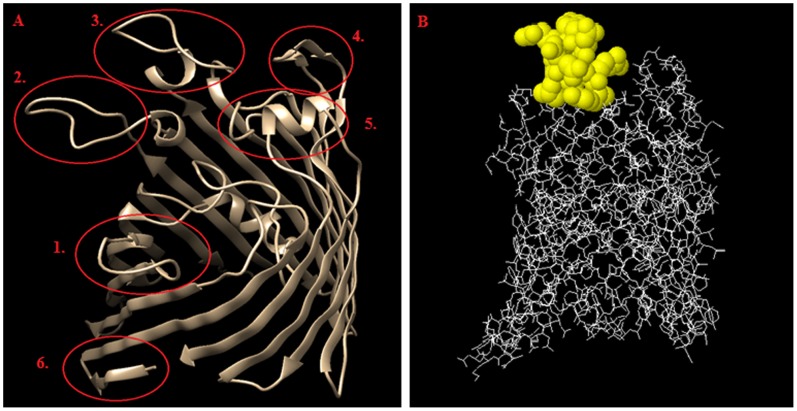
Figure 2. Summary of the bioinformatic studies on the OmpC.
A - epitope distribution on the surface of S. flexneri 3a OmpC 3D model; epitopes 1 to 5 represent outer membrane loops (1– loop II, 2– loop IV, 3– loop V, 4– loop VII, 5– loop VIII) and epitope number 6 corresponds to inner-membrane loop and has been used as a control, B – location of the epitope No. 3 (RYDERY) on the OmpC surface. Images were created by using ElliPro Prediction, and edited with Chimera Software.

