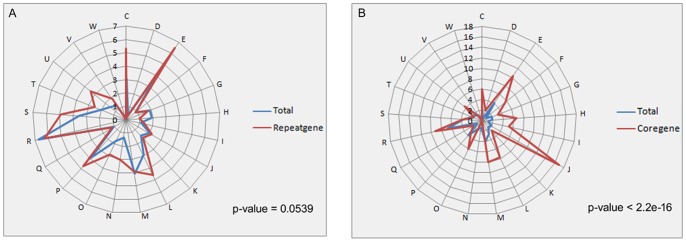
Figure 4. Spider charts of COG enrichment.

Chi-square tests were applied to test their differences. The blue line shows the COG enrichment of the total genes, whereas the red lines indicate that of repeat genes (A) and core genes (B). A. COG enrichment of the repeat genes compared with that of the total genes. Repeat genes have no significant differences compared with the total genes (p = 0.0539). B. COG enrichment of core genes compared with that of total genes. COG enrichment of core genes and that of total genes (p<2.2e-16) was significantly different between COG enrichment.
