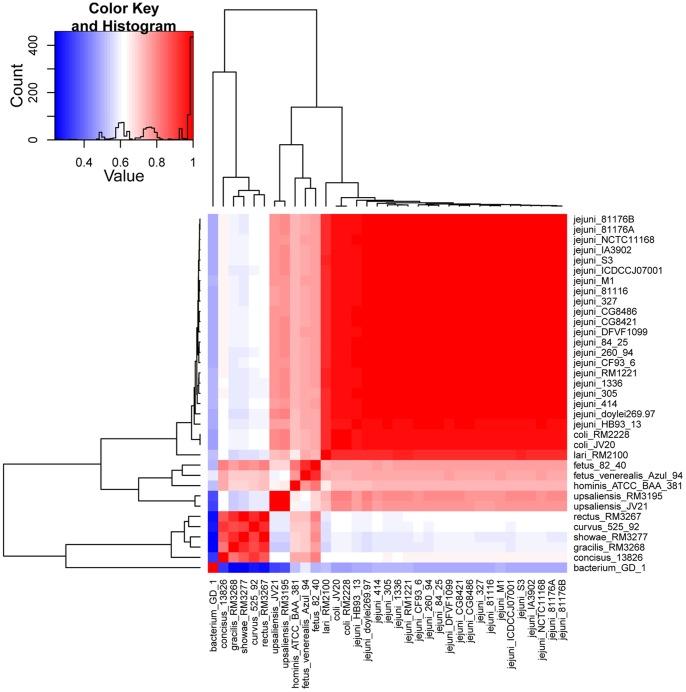
Figure 8. Tetranucleotide usage pattern (TUP) heatmap of the genus Campylobacter.
The rows and columns stand for strains. Both rows and samples are clustered using ward linkage hierarchical clustering to highlight strain groups with similar genomic signature. The tetranucleotide-derived z-values were predicted using maximum order Markov chain model. Pearson correlations for z-scores were used for clustering and as a basis for color intensity. TUPs of Campylobacterales bacterium GD 1 was used as a control.

