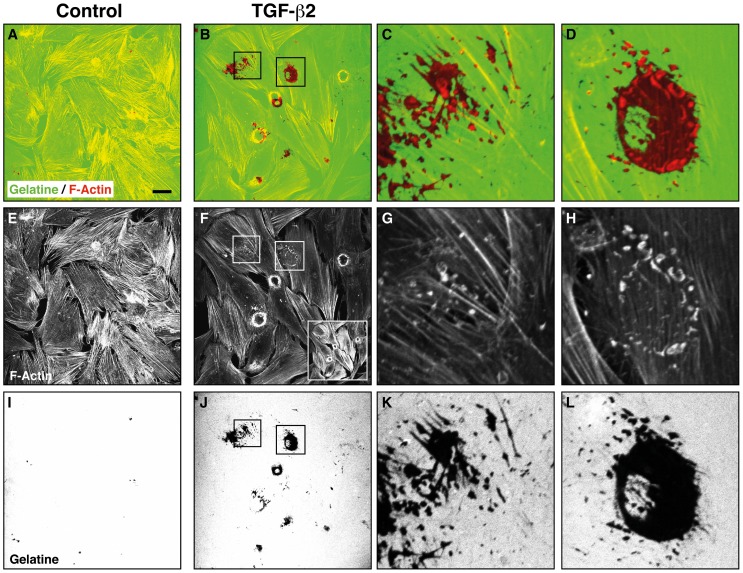
Figure 2. Effect of TGF-β2 on invadosomal proteolysis in HTM cells.
The cells were treated with vehicle or TGF-β2 for 3d before plating in the ECM degradation assay. Confocal micrographs depict fluorescently labelled gelatine (green in A–D, grayscale in I–L) and F-actin (red in A–D, grayscale in E–H). TGF–β2 increased F-actin staining intensity (insert in F) and gain was reduced (in F–H) for image acquisition to avoid signal saturation. Scale bar represents 40 µm.

