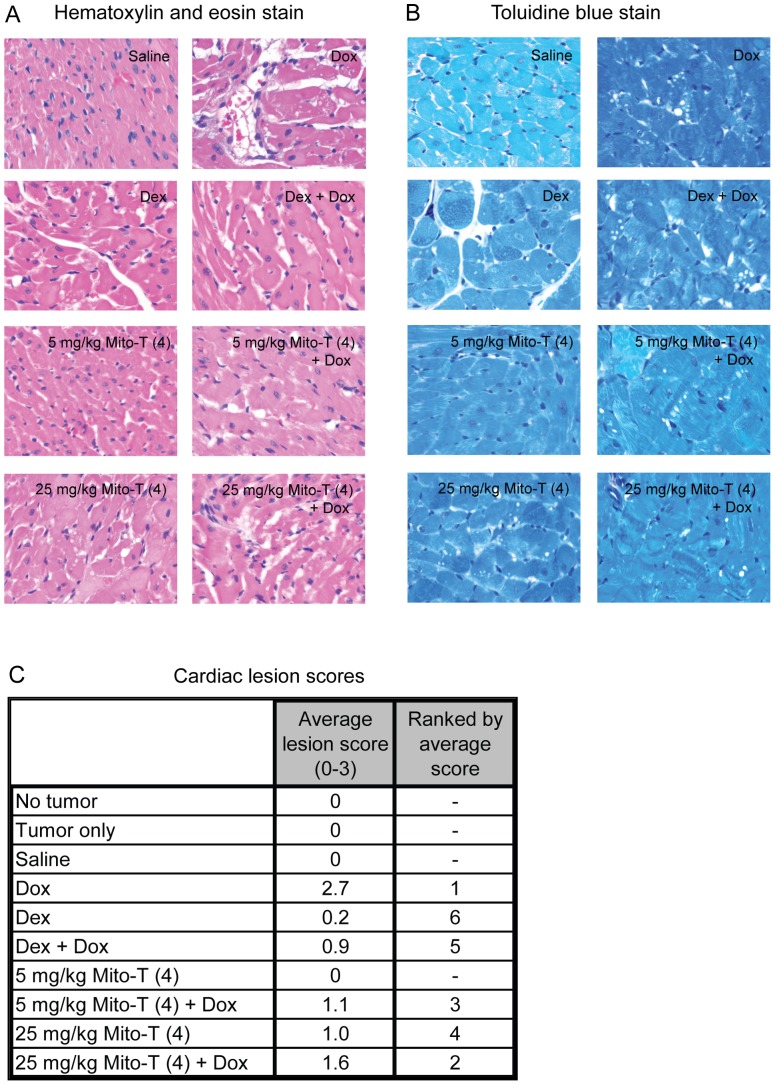
Figure 4. Cardiotoxicity and cardioprotection in SHR/SST-2 animals.
A–B, Representative photomicrographs of cardiac histological sections are shown following either hematoxylin and eosin staining (panel A) or toluidine blue staining (panel B). C, Numerical cardiomyopathy scores (maximum severity score = 3) are shown following analysis of each treatment group (n = 5). Please refer to the methods and results sections for descriptions of the scoring method and treatment-induced cardiomyopathy, respectively.

