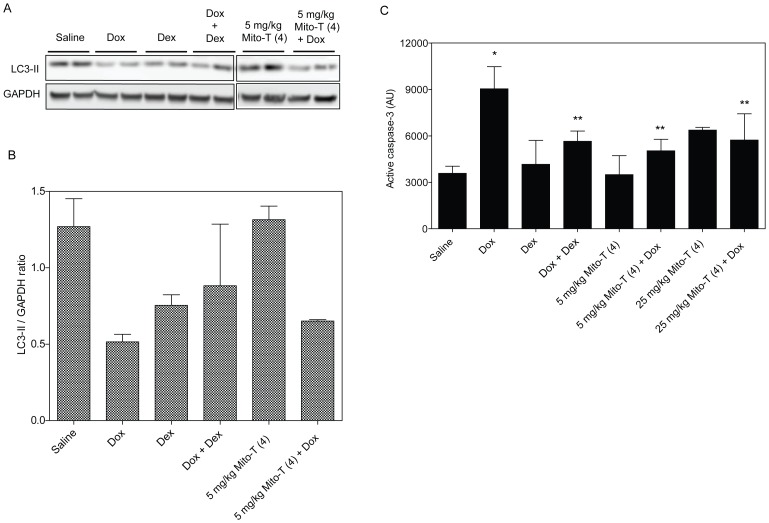
Figure 5. Autophagy and apoptosis in cardiac tissue after cardiotoxic and cardioprotective treatment.
A, Western blotting of autophagy-indicative lipidated LC-3 II protein in cardiac tissue samples. Protein extracts analyzed for LC3-II from two representative SHR/SST-2 animals per treatment group are shown. B, The mean LC3-II/GAPDH ratio in each treatment group by Western blotting analysis is shown. Quantitation was performed by densitometric analysis of the LC3-II bands from panel A. GAPDH protein levels were used as a loading control. C, Paraffin-embedded cardiac tissue were stained with anti-active caspase-3 antibody. The intensity of HRP-tagged secondary antibody was quantified as an indication of active caspase-3 using the ScanScope software. Mean intensities are shown in the graph and derived from at least 10 images per animal (5 animals per group). * = statistically significant compared to saline and ** = statistically significant compared to doxorubicin.

