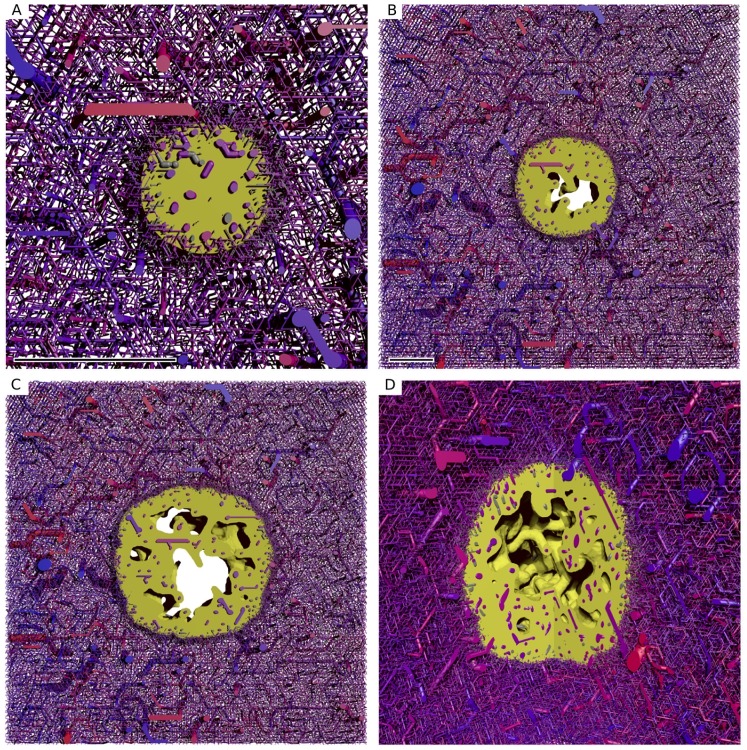
Figure 2. Snapshots from the simulation of a growing tumor.
(A) to (C) depict  thick slices through the origin. The scale bar indicates
  . (A) is a close-up. (B) and (C) have the same scale. The snapshots are taken after 100 h, 400 h, 700 h. (D) shows the same time as (C) from a different point of view where a quadrant was cut out. The boundary to the viable tumor mass is rendered as solid yellow surface. Necrotic regions appear as void spaces within the tumor. The blood vessel network is rendered as collection of cylinders, color coded by blood pressure. Red is high (arteries), and blue is low (veins).

