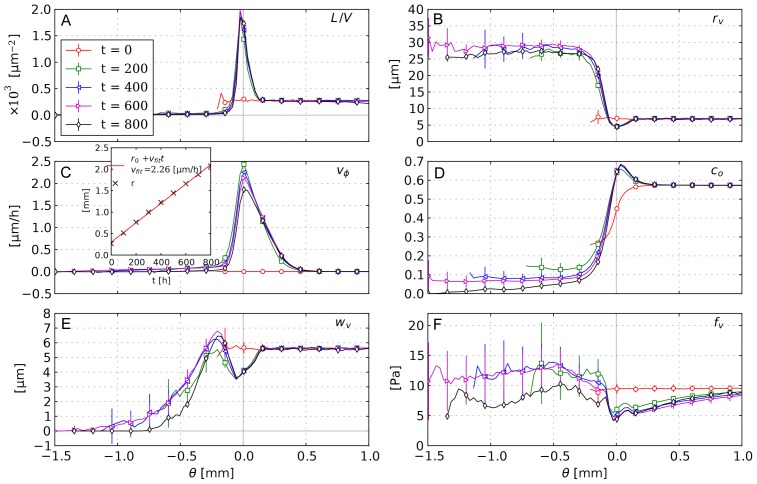
Figure 3. Radial distributions of biophysical properties in the tumor growth model.
(A) MVD, (B) vessel radius, (C) cell velocity, (D) oxygen, (E) wall thickness, (F) wall shear stress. The distributions are plotted vs. the distance from the tumor surface  . Each data point corresponds to the average over a small
  -interval. The errorbars indicate the standard deviation among different simulation runs (see text). The inset in (C) shows the approximate radius of the tumor and a linear fit. This radius is determined by averaging the distance from the origin over numerical grid cells where
  .
.

