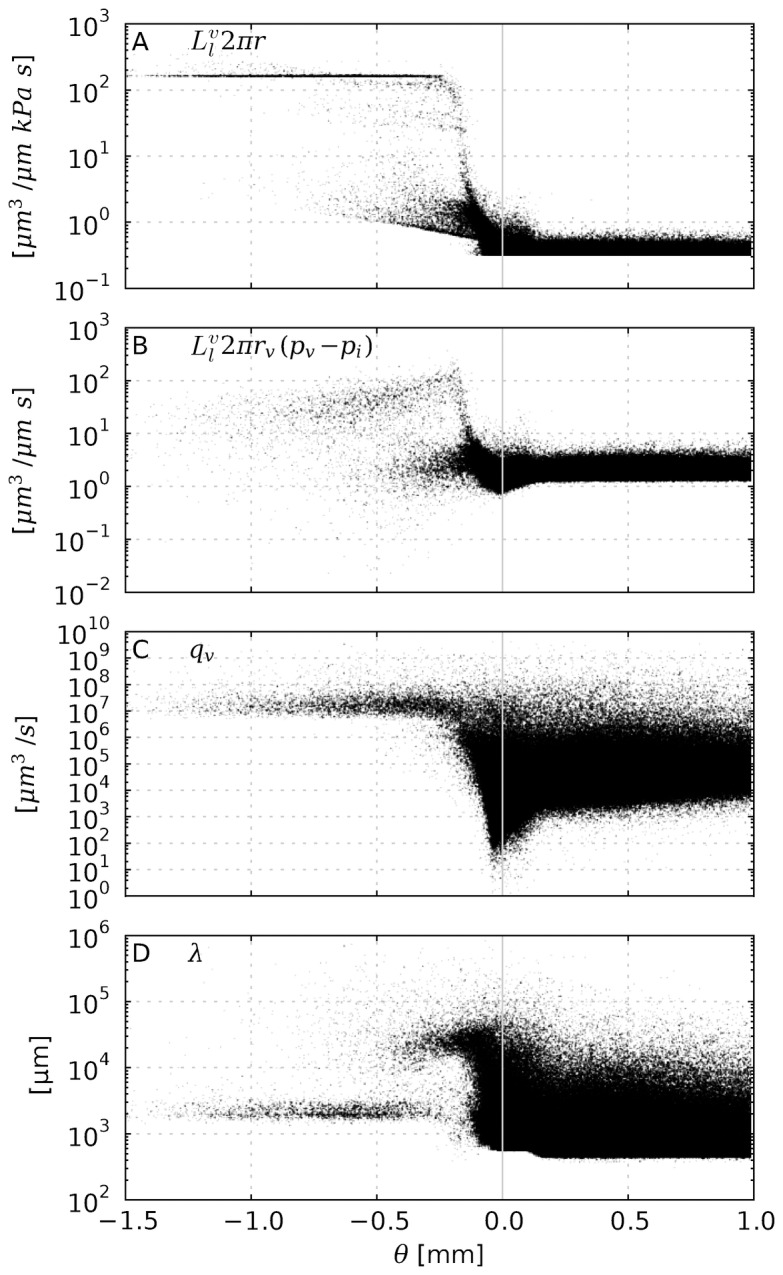
Figure 6. Radial scatter plots of properties related to (trans)vascular flow.

(A) the vessel wall permeability multiplied by the circumference  (B) the transvascular flow
  , which is the fluid volume that flows through the vessel wall per vessel length and time. (C) the flow rate of vessels
  , i.e. the blood volume per time that flows through the cross section. (D) an approximate length scale over which
  decays toward
  (see text). Data points stem from uniformly distributed sampling points on the vascular networks of 15 simulation runs.
