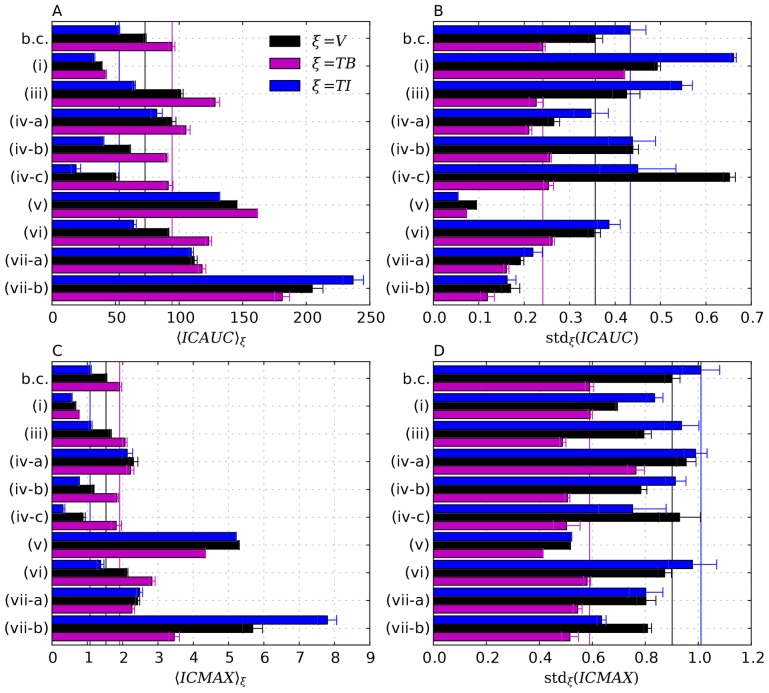
Figure 10. Comparison of the means and STDs of the probability distribution functions (PDFs) of  and
and  .
.
These quantities are presented for different regions, where each region is associated with its own PDF using  as index, where
  stands for the viable tumor mass,
  for tumor boundary and
  for tumor interior (see text). Spatial mean, indicated by brackets (or STD, indicated by
  ) are first computed for all systems in the ensemble and then averaging over the ensemble. The error bars show respective deviations from the average within the ensemble. The meaning of the case labels is as follows: (b.c.) base case, (i) heavier drug particles, i.e. molecular mass increased by a factor of
  . (iii) neglected interstitial convection, (iv) tumor vascular permeability scaled by a factor of
  (a),
(a),  (b), and
  (c), (v) hydraulic conductivity of interstitium scaled by a factor of
  , (vi) amount of normal lymphatics scaled by a factor of
  , (vii) presence of 10% (a) and 100% of the normal lymphatics amount in the tumor. Note that (ii) (prolonged infusions) are not shown due to the scale.

