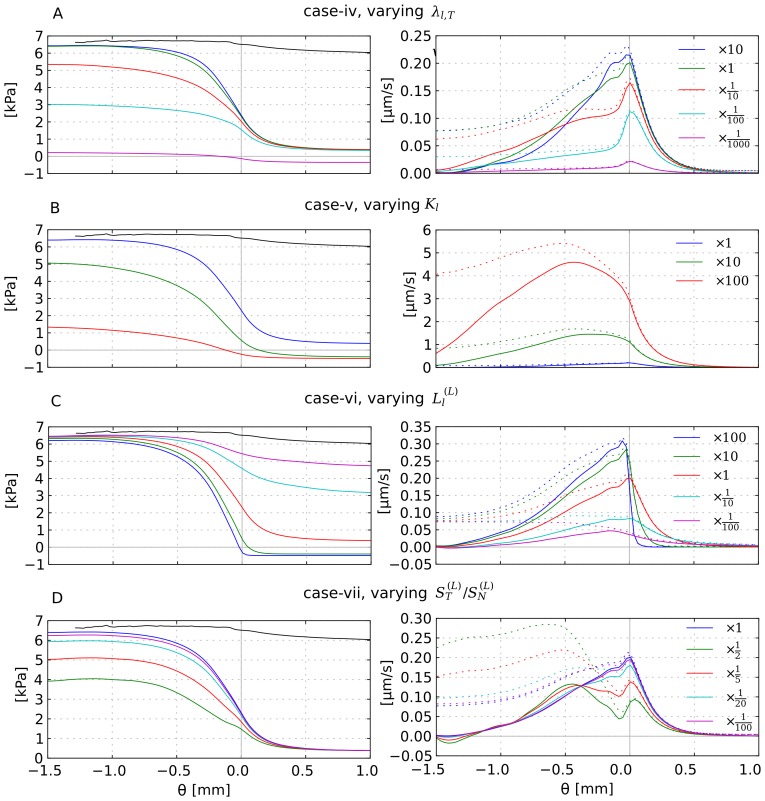
Figure 14. Radial distributions as result of parameter variations.
Left: IFP, right: IFF, averaged over 15 system analogous to Figure 5. The relative deviation from the original base case parameter values is given in the figure legends, except in (D). The considered cases are as indicated in the sub-figure heading: (A) Variation of the upper vessel wall permeability bound  (case (iv)). (B) Variation of the interstitial permeability coefficient
  (case (v)). (C) Variation of the lymphatic wall permeability
  in normal tissue (case (vi)). (D) Variation of the amount of tumor lymphatics
  , where the legend shows
  directly (case (vii).

