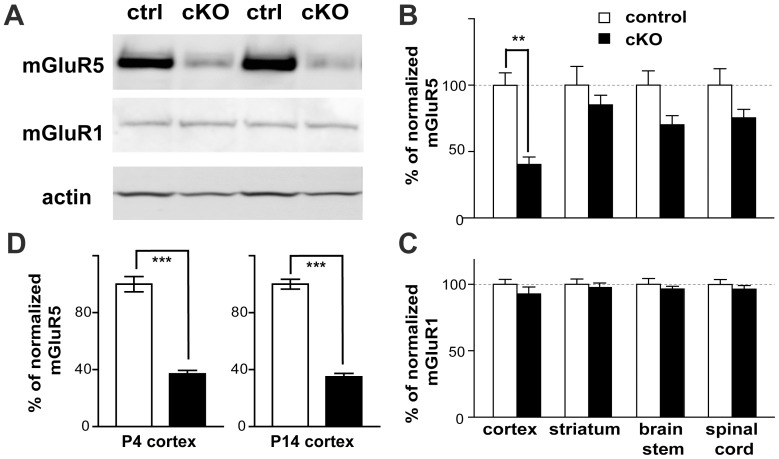
Figure 1. Reduced mGluR5 expression in the cortex of Cx-mGluR5 KO mice.
(A) Examples of the Western blots used to quantify the abundance of mGluR5, mGluR1 and β-actin in cortex isolated from 6-month old Cx-mGluR5 KO mice and their littermate controls. (B,C) Summaries for the levels of mGluR5/β-actin (B) and mGluR1/β-actin (C). (D) Summaries show reduced mGluR5 levels in the developing cortex of Cx-mGluR5 KO mice. Data are presented as mean ± SEM as % of normalized mGluR5 or mGluR1 in control mice for each specific brain region (**, p<0.01, ***, p<0.0001, Student’s t-test).

