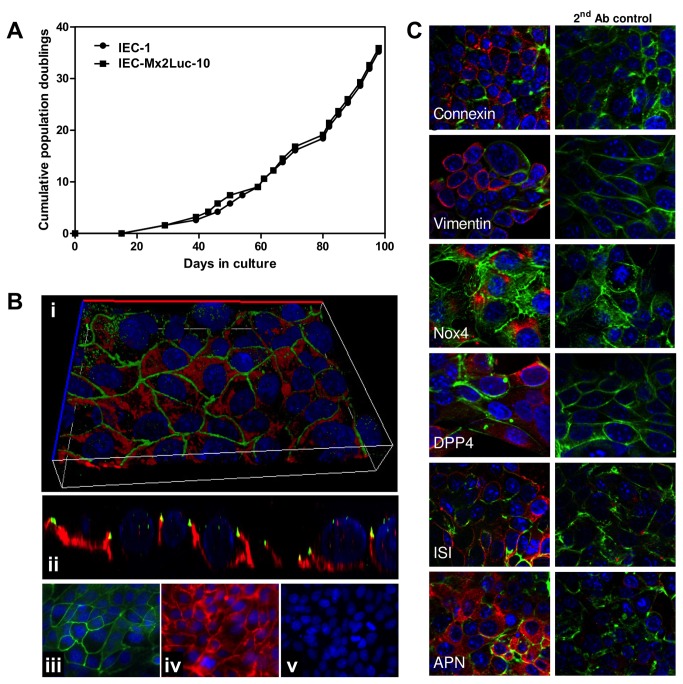
Figure 1. Characterization of polarized growth and surface marker expression.
(A) Cumulative population doublings of the representative wild type (IEC-1) and IEC Mx2Luc-10 cell clones. Primary cells ceased proliferation, died after approximately 20 days and are not included in the graph. (B) Staining of ZO-1 (green) and E-cadherin (red) by immunofluorescence. The image shows a lateral (y/z) view (i) and a three-dimensional reconstruction (ii) of the polarized epithelial cell layer with typical apical intercellular net-like ZO-1 localization and basolateral E-cadherin localization. Specificity of the staining is demonstrated by single channel images for ZO-1 (iii), E-cadherin (iv) and the secondary antibody control (v). Counterstaining with DAPI; magnification x 630. (D) Immunostaining for connexin 43, the intermediate filament vimentin, NADPH oxidase 4 (Nox4), dipeptidyl peptidase IV (DPP4), sucrase isomaltase (ISI), aminopeptidase N (APN) in red. The secondary antibody control is included to demonstrate specificity of the staining. Counterstaining with Phalloidin (green) and DAPI (blue); magnification x 630.

