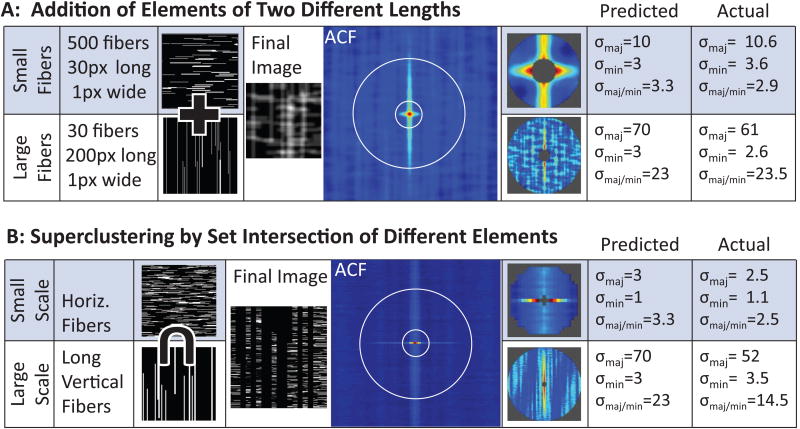
Figure 2.
GICS analysis of simulated images demonstrates the ability to characterize structures and organization of structures at different spatial scales. Part A demonstrates separation of small horizontal fibers with long vertical fibers. Images containing these two fiber types are summed, and convolved with a Gaussian point spread function to mimic laser imaging to create the final image. The ACF is then calculated, and two different central regions are fit to arbitrary Gaussian functions to calculate the standard deviation of the major and minor axis (skew or σmaj/min). Predicted values for standard deviation of the major and minor axis are calculated using theory previously presented [25]. Part B demonstrates separation of structural features at different scales. Large vertical fibers are used as a mask for a field of short horizontal fibers, such that the image is composed of short horizontal fibers superclustered into larger vertical structures. The ACF demonstrates separation of these two spatial regimes.

