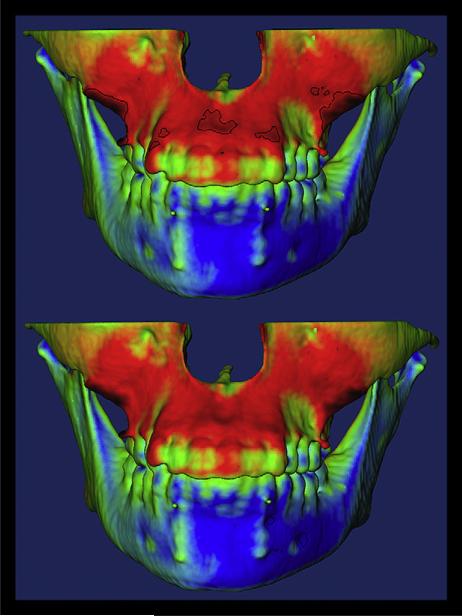
Fig 3.
The isolines, displayed as a black circle or a dot, show the regions with the greatest displacement (positive in red; negative in blue) between the T1 and T2 superimpositions. These isolines measure the closest distance between the superimpositions. The top image shows the isolines representing the regions of greatest outward displacement in the maxilla and zygomas, and the bottom image illustrates the regions with maximum inward displacement.

