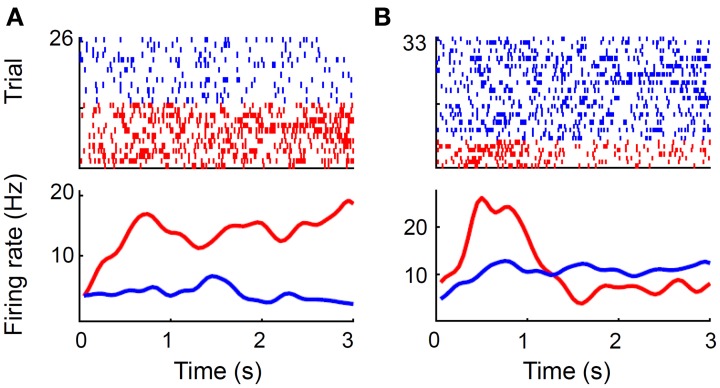
Figure 10.
Reward-related neural activity. (A) A unit that changed its firing rate during the reward period according to goal location. Trials were divided according to the chosen goal (red, left; blue, right). Only correct trials are shown. (B) A unit that changed its firing rate according to trial outcome. Trials were divided according to trial outcome (red, error; blue, correct). A spike raster plot (top) and a spike density function (σ = 100 ms) are shown for each example. Time 0 indicates the onset of the reward period.

