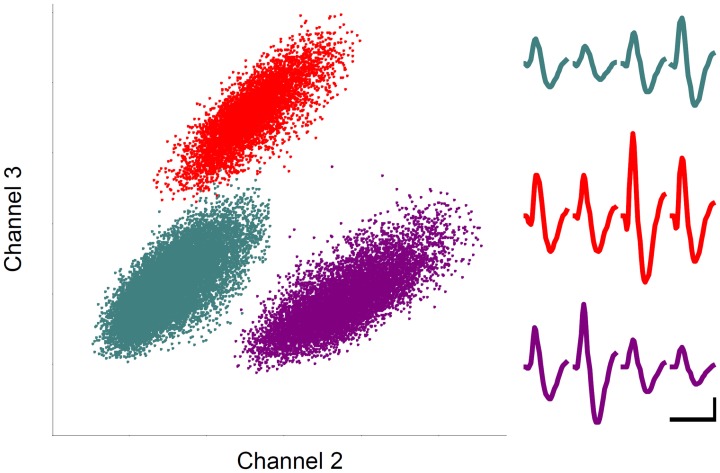
Figure 3.
Unit recording example. Each unit cluster is indicated in different color. Horizontal and vertical axes indicate the amplitudes of spike signals recorded through two different channels of a tetrode. Averaged spike waveforms recorded through four tetrode channels are shown in corresponding colors on the right. Calibration: 1 ms and 0.1 mV.

