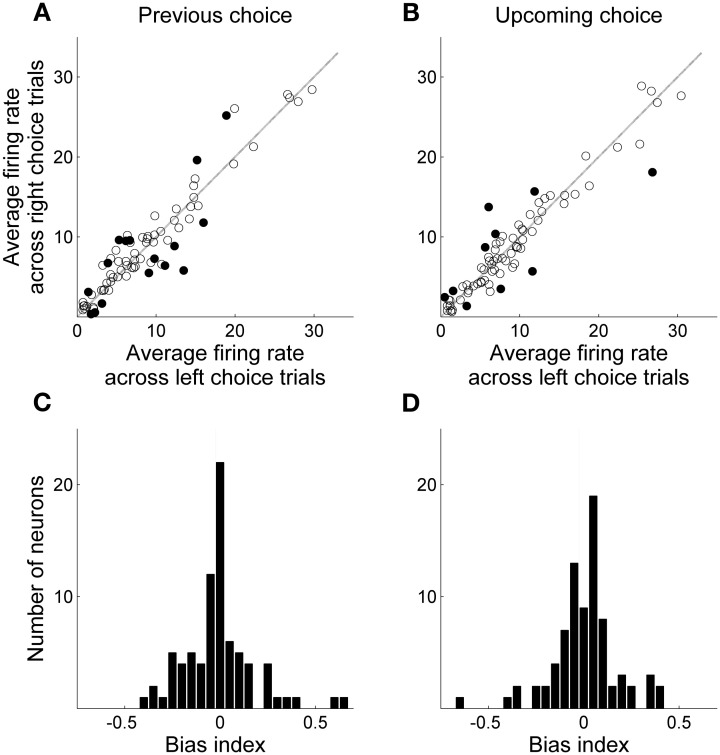
Figure 4.
Mean delay-period activity of MDN units associated with left and right goal choices. All trials were divided into two groups according to the animal's previous (A and C) or upcoming (B and D) goal choice and mean discharge rates during the entire delay period were averaged across trials within each group for each neuron. (A,B) Scatter plots relating averaged delay-period activity of individual neurons for the left and right goal choices. Filled circles denote those neurons for which average firing rates during the delay period were significantly different between left and right choices (t-test, alpha = 0.05). (C,D) Frequency histograms for the bias index.

